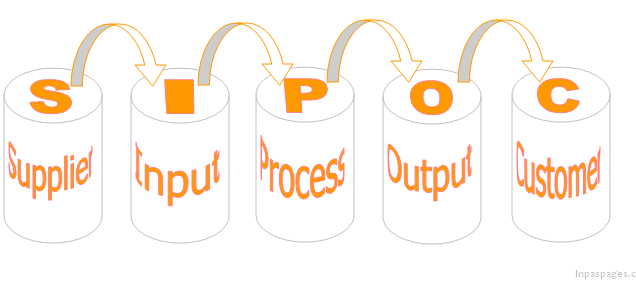
SIPOC stand for?
Supplier Input Process Output and Customer
What is SIPOC Diagram?
A SIPOC Diagram is a graphic representation of a high level process map covered suppliers & inputs into the process and outputs & customers of the process. It’s a tools that demonstration the actual control to convey meaning and understanding of process map. Generally, high level process map displays main steps of the processes that describe as basic understanding as current state of knowledge of process.
Initially SIPOC is a six sigma tool that previously used for quality improvement & management. Now widely used in six sigma concept & Lean concept that is lean manufacturing & other purpose to keep basic understanding for manual themes.
Where we can Use?
- Easier a way to learn, give primary understanding to people of concern audience Thought SIPOC Diagram with high level synopsis.
- SIPOC methodology that gives impression to steps that make aware to team / audience that how each step associated to others or next process, which makes a sense to learn by systematic ways importance of particular objects to particular step.
- Its can help to people who familiar with it, can get better idea to include or odd if any reflect module of finance or others as management decided.
Basic Understanding of each step of SIPOC Diagram:
- S – Suppliers – that means not just meaning of supplier materials, it can be services providers, Information Providers etc…
- I – Input – can be material, service, information, work or ideas to involve for process or in used.
- P – Process – to show what happening input on this particular stage, summaries of whole system procedure of process describe on this stage.
- O – Output – as same of input can be material, service, information, work or ideas / thoughts with furnished / Finalize in process system for deliver for next.
- C – Customer – Simply customer is user of finalized output from furnished in process stage.
How to use SIPOC diagram?
- Crate Process Stages: To building a SIPOC Diagram, generally five to six steps of high level process map can generate as inputs to output of the process, its indicate process start to process ends.
- Create Input List against process stage: Identify where from process’s inputs are comes, inputs can also include requirements like raw materials, bill of materials etc., may have purity level to meet quality requirements.
- Create supplier list against inputs: Identify the systems, upstream processes, manpower / peoples that supply the inputs. List out suppliers on the diagram.
- Create Customer: identify end user of outputs’ is customers. Using SIPOC can help to identify users like people, processes that receive the output.

Pingback: SIPOC Diagram / Process mapping
Pingback: What is Turtle Chart / Turtle Diagram? - Learn how to use Turtle chart