Electricity consumption analysis, reduce and control in organization
The article describes the information, how to conduct electricity consumption analysis by monitoring on company objectives. The analysis will helps you to control over the excess electricity consumption as well significant reduction in electricity use.
Objectives / Key performance indicator monitoring
Objectives or Key performance indicators are show the directions, improvements & growth of the company. Objective analysis, monitoring and controls is one of the best methods to reduce consumption of any key objective. Here we are targeting DNR (Depreciation of natural resources) reduction that help to reduce environmental and financial impacts.
Here we are focus on very important natural resources is consumption of electricity. We are going to discuss on how to reduce consumption of electricity, and effective control on it. That will also helps to reduce significant impacts on environment.
How to reduce consumption of electricity?
Electricity is basic requirements for any manufacturing or engineering organization. Presently due to new concepts of business systems, peoples are awareness grow up to reduce energy. Awareness about natural resources reduce to minimize impacts on environment. Reducing electricity consumption without affect regular operations is very tough job. That will be possible through effective analysis of daily consumption data of electricity.
To reduce electricity consumption, you have to sufficient data for analysis. There are many technique to analyze information of electricity consumption. There two methods for analysis electricity consumption units are :
- Collect data from of whole company i.e. all the units and divisions
- Count data of particular machine / equipment for single unit measurements.
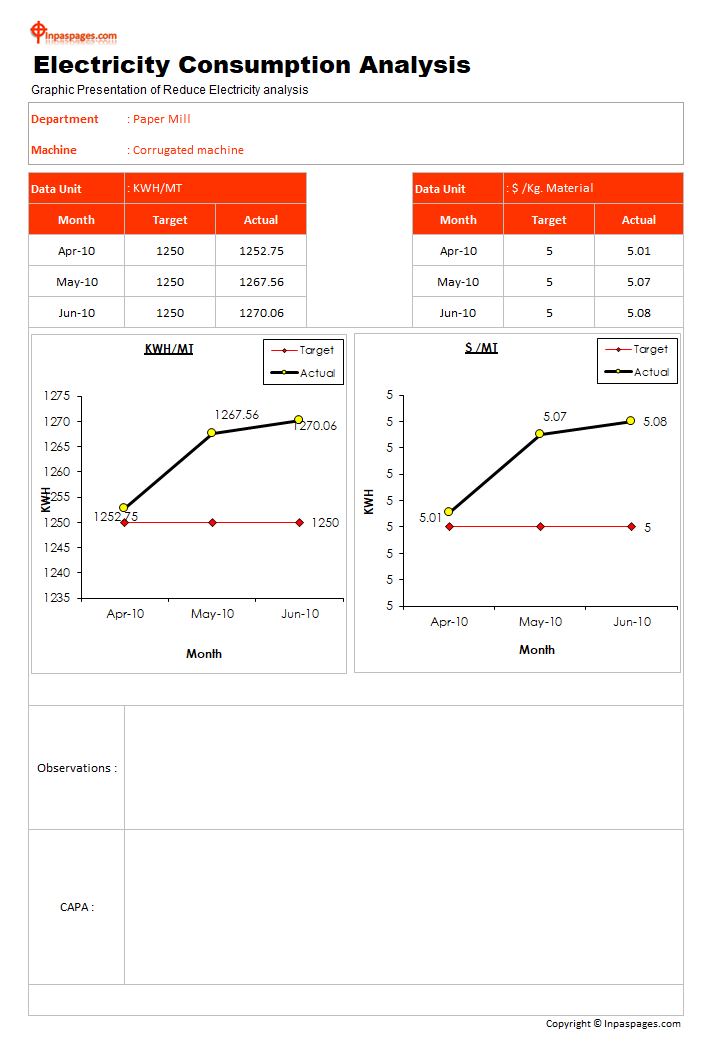
Here we concentrate on single machine electricity consumption to evaluate success. It can possible to implement on remain parts later on. See example format:

Electricity consumption analysis
Objective monitoring is simple process that monthly data are mentioned in single sheet that show the state consumption records are consider, analysis and controls are possible. But counting on particular machine wise electricity consumption and analysis are impossible in objective monitoring sheet, finest solution is electricity consumption table and chart analysis for the particular recording.
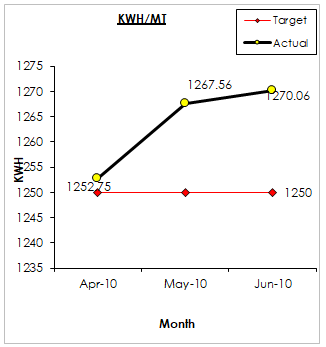
Electricity consumption table & chart records, that give a complete information for the analysis of the last two to three months with various combinations like KWT/MT and $/MT. More analysis means more result that gives a direction to decisions that gives reduction of electricity consumption on particular machine.
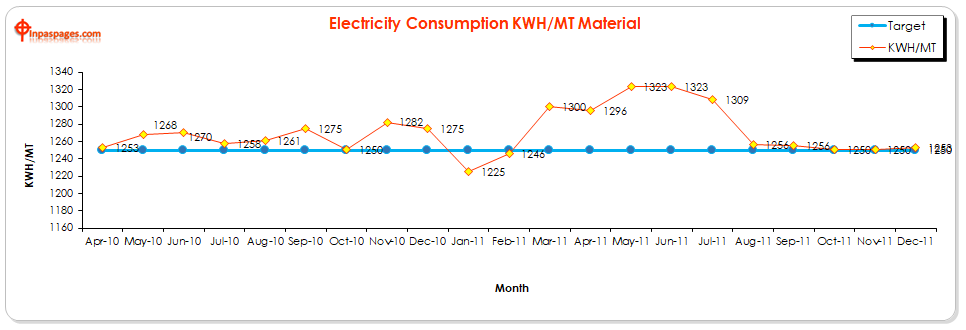
Electricity consumption chart Analysis
For Objective Monitoring that is electrical consumption analysis on any machine that needs to target points on base of previous & possible reduction line to possible for future consumption reduction. Consumption records can be maintain in various combinations for the find root cause and help in analysis to load the machine electricity if any particular product ingestion. Some example for more knowledge:

See Picture above, there are too much variation in electricity consumption per metric ton. In Feb-11, suddenly drop down but against drastically gain up means, there are no any human interfere are or any action taken by human shows in above graph. It all due to internal production problem might machine in maintenance. In the same situation you can see in Electricity consumption in $/Kg & $/MT.

Sheet No.2, having a individual 03 month data to compare all three months electricity consumption not reducing. Its gain up need to take any necessary action to reduce it. Why the electricity consumption gain up against MT produced by the machine? – is all are need to analysis by find the root cause and corrective and preventive action with impact to future consumption affect.

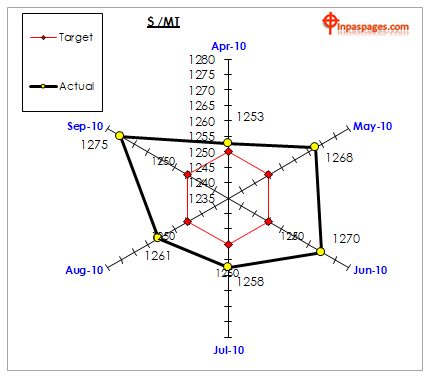
To better understanding, you can see above radar chart that all the data are goes so far to targets, actually its all should be around near the red line, further variation also show in actual data that captured during operations.