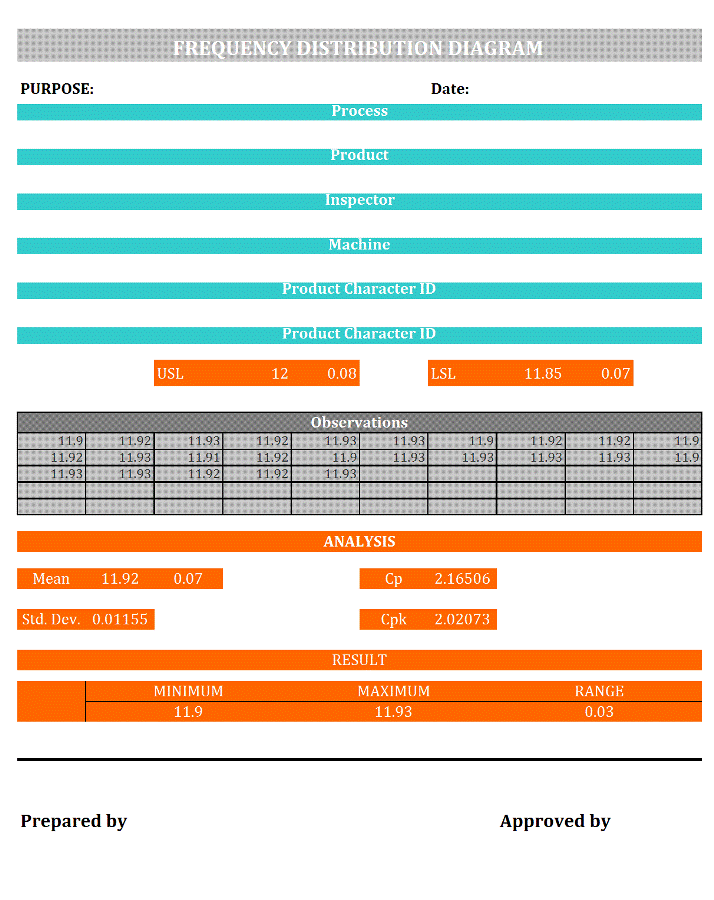
Frequency Distribution Diagram
Through statistically, a frequency distribution diagram is well structured more that two product parameter or variables taken for analysis to identify the variables’ boundaries, variations that is minimum & maximum level that support to identify the product’s parameter’s deviation through observe stage levels of the product, this variation & deviation of product’s according to result are on base of the product are taken for the analysis only, may be possible that same product having different result to variation found. Its all depends on requirements for the analysis through frequency distribution diagram is:
- Product
- Process
- Observations
- Machine
In the Frequency Distribution diagram is the combinations & its results are consider for the as final result of the all possible combinations of frequency readings of the different process with different machines on single product’s parameter. All the variables are consider with on multiple to merged form for the analysis can possible to get the real result in line with Product’s parameter requirements.
You can see above picture having a given the basic requirements that purpose is required for as title of the format that is owner of this whole diagram or can also say that its all request for this analysis and same against date usually indicate when this frequency distribution diagram is prepared or analysis done on.
Process for the frequency distribution diagram are prepared, to consider the process all the product parameter are taken in place or variable are taken for analysis as sample against which product is taken with the process are need to define for analysis, this statistical analysis are for find out product’s parameter maximum, minimum and range level to ensure the product parameter are possible to defined, established, modify can possible.
During this process analysis are monitored by qualified inspector, its necessary to monitoring this whole frequency distribution analysis by qualified inspector because this process result can reflect the future variables and business concern.
In Frequency distribution diagram is not one time process that done and get result are fine to decision are taken for further action, NO this all are need to patient to finalized decisions on base of single result, this process and product ‘s frequency distribution result are for taken on single machine, need to same product and process with one more machine are need to taken and get the result, both result are match through same frequency distribution diagram to get the average result will finest and final result to ensure the product parameter now can possible to set on which machine is given huge variation and deviation, for the further action are depends on the result of the variations of the product parameters are taken as samples.
To consider the serious requirements of the production department as well as R & D department, here are ready made sample with filled sample data for learning purpose. All the data are given is not real or not concern with really observed in any place, you can download format of frequency distribution diagram for your company and take as this format data as sample for your concern.
Download Frequency Distribution Diagram Format in Excel Sheet document
Frequency Distribution Diagram Sample, Descriptions, Definition, Example, Template
Frequency Distribution Diagram Format in Excel Sheet / Word Document / PDF
Related Topics:
STATISTICAL PROCESS CONTROL (SPC) STUDY PLAN
PROCESS FLOW CHART CHECKLIST POINTS
PRODUCT/PROCESS QUALITY CHECKLIST POINTS
